Deriving covariance and variances of coefficients <slope and intercept> of Simple Linear Regression <Var(beta), Cov(beta0, beta1)>

Suppose a simple linear regression model:

 Y_i = \beta _0 + \beta _ 1 X_i + \varepsilon _ i

This post will explain how to obtain the following formulae:

 \displaystyle Var ( \hat{\beta _ 0} ) = \sigma ^ 2 \left ( \frac{1}{n} + \frac{\bar{x}_{n}^{2}}{s^{2}_{x}} \right )

 \displaystyle Var( \hat{\beta _ 1}) = \frac{\sigma ^2}{s^{2}_{x}}

 \displaystyle Cov( \hat{\beta _ 0},  \hat{\beta _ 1}) = -\frac{\bar{x}_n \sigma^{2}}{s^{2}_{x}}

 \displaystyle Var( \hat{\beta _ 1}).

\begin{align} \displaystyle Var( \hat{\beta _ 1}) &= Var \left ( \frac{ \sum ^{n}_{i=1} (X_i - \bar{X} ) Y_i }{s^{2}_{x}} \right ) \\ &= \frac{1}{s^{4}_{x}} Var ( \sum ^{n}_{i = 1} (X_i - \bar{X} ) (\beta _{0} + \beta _{1} X_{i} + \varepsilon _{i}))\\ &= \frac{1}{s^{4}_{x}} Var ( \sum ^{n}_{i = 1} (X_i - \bar{X} ) \varepsilon _{i})\\ &= \frac{1}{s^{4}_{x}} \sum ^{n}_{i = 1} Var ( (X_i - \bar{X} ) \varepsilon _{i})\\ &= \frac{1}{s^{4}_{x}} \sum ^{n}_{i = 1} (X_i - \bar{X} ) Var (\varepsilon _{i})\\ &= \frac{1}{s^{4}_{x}} \sum ^{n}_{i = 1} (X_i - \bar{X} ) σ^{2}\\ &= \frac{ σ^{2}}{s^{4}_{x}} \sum ^{n}_{i = 1} (X_i - \bar{X} )\\ &= \frac{ σ^{2}}{s^{4}_{x}} s^{2}_{x}\\ &= \frac{ σ^{2}}{s^{2}_{x}} \end{align}

  • Line 1→2:  Y_i = \beta _0 + \beta _ 1 X_i + \varepsilon _ i
  • Line 2→3: We consider  \beta _0 + \beta _ 1 X_i as constant, and Var(A+constant) = Var(A)
  • Line 3→4: We assume homoscedasticity

 \displaystyle Var ( \hat{\beta _ 0} )

\begin{align} \displaystyle Var ( \hat{\beta _ 0} ) &= Var(\bar{Y} - \beta_{1} \bar{X} )\\ &= Var( \bar{Y} ) + \bar{X}^{2} Var(β_{1} ) - 2 \bar{X} C o v ( \bar{Y}, \hat{β} _{1} )\\ &= A + B + C \end{align} We consider each term of left hand side (= A, B, C) one by one.

A

\begin{align} \displaystyle Var( \bar{Y} ) &= Var( \frac{1}{n} \sum ^ {n} _{i=1} Y_{i} )\\ &= \frac{1}{n^{2}} n Var(Y_{i} )\\ &= \frac{σ^{2}}{n} \\ \end{align}

B

\begin{align} \displaystyle \bar{X}^{2} Var(β_{1} ) = \bar{X}^{2} \frac{ σ^{2}}{s^{2}_{x}} \end{align}

↑From previous result

C

\begin{align} \displaystyle C o v ( \bar{Y}, \hat{\beta}_{1} ) &= C o v ( \frac{1}{n} \sum_{i=1}^{n} Y_{i}, \frac{\sum_{j=1}^{n} x_{j}-\bar{x} Y_{j}}{s_{x}^{2}} ) \\ &= \frac{1}{n} \frac{1}{s_{x}^{2}} C o v ( \sum_{i=1}^{n} Y_{i}, \sum_{j=1}^{n} (X_{j}-\bar{X} ) Y_{j} \\ &=\frac{1}{n s_{x}^{2}} \sum_{i=1}^{n} ( X_{i}-\bar{X} ) \sum_{j=1}^{n} C o v ( Y_{i}, Y_{j} ) \\ &=\frac{1}{n s_{x}^{2}} \sum_{i=1}^{n} ( X_{i}-\bar{X} ) σ^{2} \\ &=\frac{σ^{2}}{n s_{x}^{2}} \sum_{i=1}^{n} ( X_{i}-\bar{X} ) \\ &=0 \end{align}

A + B + C

Therefore,

\begin{align} \displaystyle V a r ( \hat{β }_ {0} ) &= \frac{σ^{2}}{n} + \bar{X}^{2} \frac{ σ^{2}}{s^{2}_{x}} + 0 \\ &= σ^{2} ( \frac{1}{n} + \frac{ \bar{X} ^{2} }{s^{2}_{x} } ) \end{align}

 \displaystyle Cov( \hat{\beta _ 0},  \hat{\beta _ 1})

\begin{align} C o v ( β_{1}, \hat{β}_{1} ) &=\mathbb{E} ( ( \hat{\beta}-\bar{\hat{β}}_{0} ) ( \hat{β}_{1}-\bar{\hat{β}}_{1} ) ) \\ &=\mathbb{E} ( ( \hat{β}_{0} - β_{0} ) ( \hat{β}_{1}-β_{1} ) ) \\ &=\mathbb{E} ( ( \sum_{i=1}^{n} ( \frac{1}{n} - \frac{\bar{X}(X_{i} - \bar{X} ) } {\hat{s}^{2}_{x} }) ε_{i} \sum ^ {n} _{i=1} ( \frac{X_{i}-\bar{X}}{s_{x}^{2}} ) ε_{i} ) ) \\ &=\mathbb{E} ( \varepsilon_{i}^{2} ) \sum_{i=1}^{n} ( - ( \frac{1}{n} - \frac{ \bar{X} ( X_{i}- \bar{X} ) }{s_{x}^{2}} ) \frac{X_{i}-\bar{X}}{s_{x}^{2}} ) \\ &=σ^{2} ( - \frac{\bar{X}}{ ( s_{x}^{2} ) ^{2}} \sum_{i=1}^{n} ( X_{i}-\bar{X} ) ^{2} ) \\ &=σ^{2} ( - \frac{\bar{X}}{ ( s_{x}^{2} ) ^{2}} s_{x}^{2} ) \\ &=-\frac{σ^{2} \bar{X}}{s_{x}^{2}} \end{align}

ホークス過程(Hawkes Process)の説明とPythonでのシミュレーション

ホークス過程とは

イベントが起こった直後に、再びそのイベントが起こりやすい現象をモデル化する時に便利なモデル

例えば、大きな地震が起こったときは、直後に余震が起こりやすい

ほかにも、くしゃみをした時は、そのあと連続でくしゃみが続きやすい

ここで、以下の3つの特徴を持つintensity (=強度関数)というものを考える

  1. intensityが大きいほど次のイベントがすぐ起こりやすい
  2. またintensityは時間とともに減っていく
  3. イベントが起こるとintensityが上昇する

このように考えると、イベント発生と、intensityの変化は以下のように図示できる

f:id:babaye:20191017204947j:plain
Rizoiu, et al. (2017)

イベント(地震)が起きるとintensityが上昇し、なにもないときは緩やかに下降しているのが確認できるだろう(一番下のグラフ)

ホークス過程の数式

intensityをλとして表す

指数関数に従ってintensityが減衰すると仮定するのが最もシンプルでよく使われている

 \displaystyle λ(t)=ρ +α \sum_{t_{k} \lt t} exp^{- β (t-t_{k} ) }

ただし、ρはbase intensityと呼ばれ、平時にイベントが起こる確率

αはイベントが起こったときにどれくらいintensityが上昇するかを表すパラメータ

βはintensityの減少の早さを示すパラメータ

αとβの設定の仕方次第でintensityが発散してしまうので注意

ここでの \sumでは、過去(つまり t_k \lt t)に起きたすべての各イベントによるintensityの影響を足している

たとえば、計測開始から2秒後と5秒後にイベントが起こったとすると、(6秒の地点のintensity)=(base intensityのρ) + (1秒前に起こったイベントによる増加分たくさん) + (4秒前に起こったイベントによる増加分すこし)   である

コード

import numpy as np
import matplotlib.pyplot as plt

# hyperparameters
mu = 0.1
alpha = 1.5
beta = 30

# 
neuton_iter_num = 200
num_datapoints = 15

# step1
U = np.random.uniform(0, 1)
# step2
t1 = -np.log(U)/mu
t = [t1]


for k in range(num_datapoints):
    # step3
    U = np.random.uniform(0, 1)
    
    # step 4
    if k == 0:
        Sk = 1

    u = t[k] - np.log(U)/mu  # initial value of iteration
    for _ in range(neuton_iter_num):
        fu  = np.log(U) + mu*(u-t[k])  + alpha/beta*Sk*(1-np.exp(-beta*(u-t[k])))
        fu_dash = mu+alpha*Sk*np.exp(-beta*(u-t[k]))
        u -= fu/fu_dash

    # step 5
    t.append(u)
    Sk = np.exp(-beta*(t[k+1]-t[k]))*Sk + 1  # find S(k+1)

t = np.array(t)/max(t)

# plt.figure(figsize=(20, 10), dpi=50)
# plt.scatter(t, np.ones(len(t)), facecolors='none', edgecolors='red')
# plt.show()


# intensity
time = np.linspace(0,1,10000)
increase = list(map(lambda x: alpha*np.exp(-beta * x), time))
intensity = np.zeros(10000*2)
for timepoints in t:
    yuko = np.append(np.append(np.zeros(len(time[time<timepoints])), increase), np.zeros(len(time[time>=timepoints])))    
    intensity += yuko


# plt.figure(figsize=(20, 10), dpi=50)
# plt.plot(time, intensity[:10000])
# plt.show()


fig, ax1 = plt.subplots(figsize=(20, 5))
ax2 = ax1.twinx()
ax1.scatter(t, np.ones(len(t)), facecolors='none', edgecolors='red', marker='*', s=150)
ax2.plot(time, intensity[:10000], c='b', lw=1)
plt.show()

出力結果:

f:id:babaye:20191017214323p:plain
上記コードの出力結果

参考文献

P-Spline(Penalized Smoothing Splines)をRで実装し、なめらかな曲線をグラフに載せる

Penalized Smoothing Splines (通称P-spline, pspline)をRで走らせてみた

コード例

公式*1からのコピペ

# パッケージのインストールと読み込み
install.packages("pspline")
library(pspline)

# データの読み込み
data(cars)
attach(cars)

# 元になるデータをプロット
plot(speed, dist, main = "data(cars) & smoothing splines")

# df=10でP-Splineを描画(赤色)
lines(sm.spline(speed, dist, df=10), lty=1, col = "red")

# df=100でP-Splineを描画(緑色)
lines(sm.spline(speed, dist, df=100), lty=1, col = "green")

# 凡例の追加
legend("topleft", legend = c('df=10', 'df=100'), col = c("red", "green"),  lty=c(1, 1))

f:id:babaye:20191005120623p:plain

以上から、dfが大きいと、よりギザギザしたものになることが確認できる(バイアスバリアンストレードオフ

人工データ

 \displaystyle y = \sin (x) - \cos (x/2 - 5)*1.5 + 0.3*\sin (x * 10)
x = (1:50)/3
y = sin(x) - cos(x/2 - 5)*1.5 + 0.3*sin(x*10)
plot(x, y)
lines(sm.spline(x, y, df=5), lty=1, col = "red")
lines(sm.spline(x, y, df=10), lty=1, col = "green")
legend("bottomleft", legend = c('df=5', 'df=10'), col = c("red", "green"),  lty=c(1, 1))

f:id:babaye:20191005130526p:plain

応用

株式の取引間隔のデータに応用すれば、以下のように日中季節性を取り出すことも出来る

使用したのは日本の某銘柄の某日の一日の全取引履歴(前場後場をつなげている)

f:id:babaye:20191005122716p:plain x軸は時間(取引開始〜取引終了)
y軸は取引間隔

それぞれの点は各取引がいつ行われたかと、その取引が前回の取引からどのくらい時間が経っているかを示している

相場が開いた直後、閉まる直前は取引間隔が短くなっている。また、グラフ中心の昼休憩の周辺でも取引感覚が短くなっているのが確認できる

P-Splineで日中季節性をとらえることができた

理論

いまここで、

 \displaystyle y _ j =x\left(t _ j \right)+\varepsilon _ j , \;  j=1, \ldots, n

を考える。ただし、x\left(t _ j \right)は後から予想して引く曲線、y _ jは観測点であるとする

さて、x\left(t _ j \right)をどんな曲線にすればいいか決めるにはどうしたらよいか

まず思いつくのは誤差二乗和だろう

 \displaystyle S S E(x | y)=\sum_ j \left(y_ j -x\left(t_ j \right)\right) ^ 2

もうひとつ、良い曲線を定義するために、グラフを用いながら考えてみる f:id:babaye:20191005130129p:plain ↑のような観測点があったら、引きたい曲線は以下のようになるだろう f:id:babaye:20191005130251p:plain ただ、以下のように曲線を引くことも出来る f:id:babaye:20191005130400p:plain このギザギザ度をペナルティーとしたのがP-Splineである

ペナルティーは、

 \displaystyle \sum _ {i=1} ^ N \left(y-\alpha-f(x ; \beta) +\sum _ {p=1} ^ P f\left(z _ {i p} \right)  \right) ^ 2 +\lambda \int \left(f ^ {\prime \prime} (x) \right) ^ 2 dx

と定義できる。

参考文献・リンク

pythonでブラウン運動(ランダムウォーク)のシミュレーション(1次元・3次元)

1次元

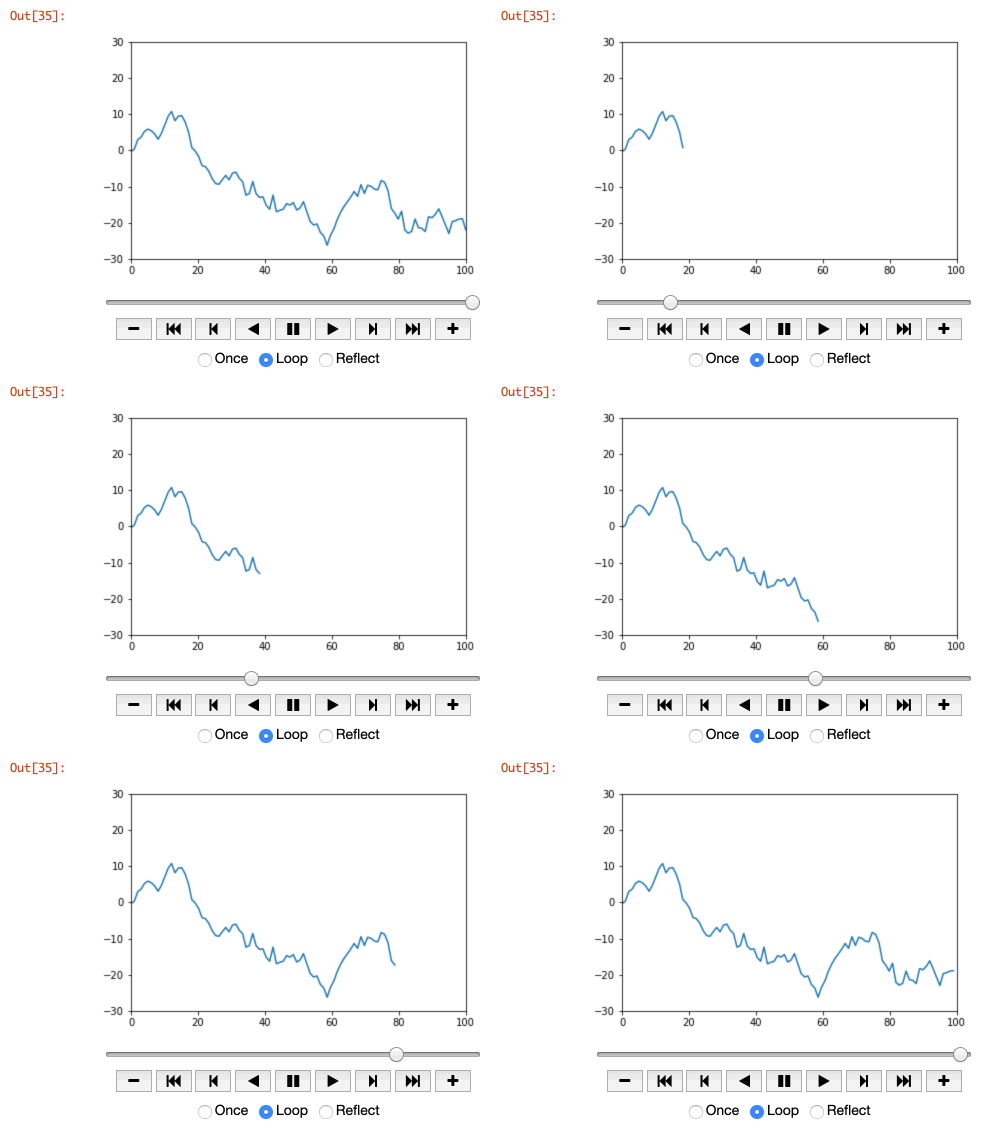
f:id:babaye:20190901185754g:plain

matplotlib.animation.FuncAnimation の機能を使って、Jupyter Notebook上でブラウン運動をシミュレーションすることが出来る(注意:Jupyter lab, Google Colabなどで動かない可能性があります。)

import numpy as np
import matplotlib.pyplot as plt
from matplotlib.animation import FuncAnimation
from IPython.display import HTML

# parameters
n = 100  # タイムステップ数
trend = 0.0001  # トレンド成分
variance = 2  # 分散

fig, ax = plt.subplots()
x, y = [], []
g, = plt.plot([], [], '-', animated=True)
plt.close()

movement = np.cumsum(np.random.randn(n + 1)*variance + np.cumsum(np.linspace(0, (trend)*n, n+1)))
movement = np.append(np.array([0]), movement[:n])


def init_func():
    ax.set_xlim(0, n)
    ax.set_ylim(movement.min()*1.2, movement.max()*1.2)
    return g,

def func(frame):
    x.append(frame)
    y.append(movement[int(frame)])
    g.set_data(x, y)
    return g,

a = FuncAnimation(fig, func, frames=np.linspace(0, n, n),
                    init_func=init_func, blit=True)

HTML(a.to_jshtml())

ちなみに、動かないバージョンは以下の簡単なコードで実装できる

import matplotlib.pyplot as plt
variance = 1
plt.plot(np.cumsum(variance*np.random.randn(100)))
plt.show()

3次元

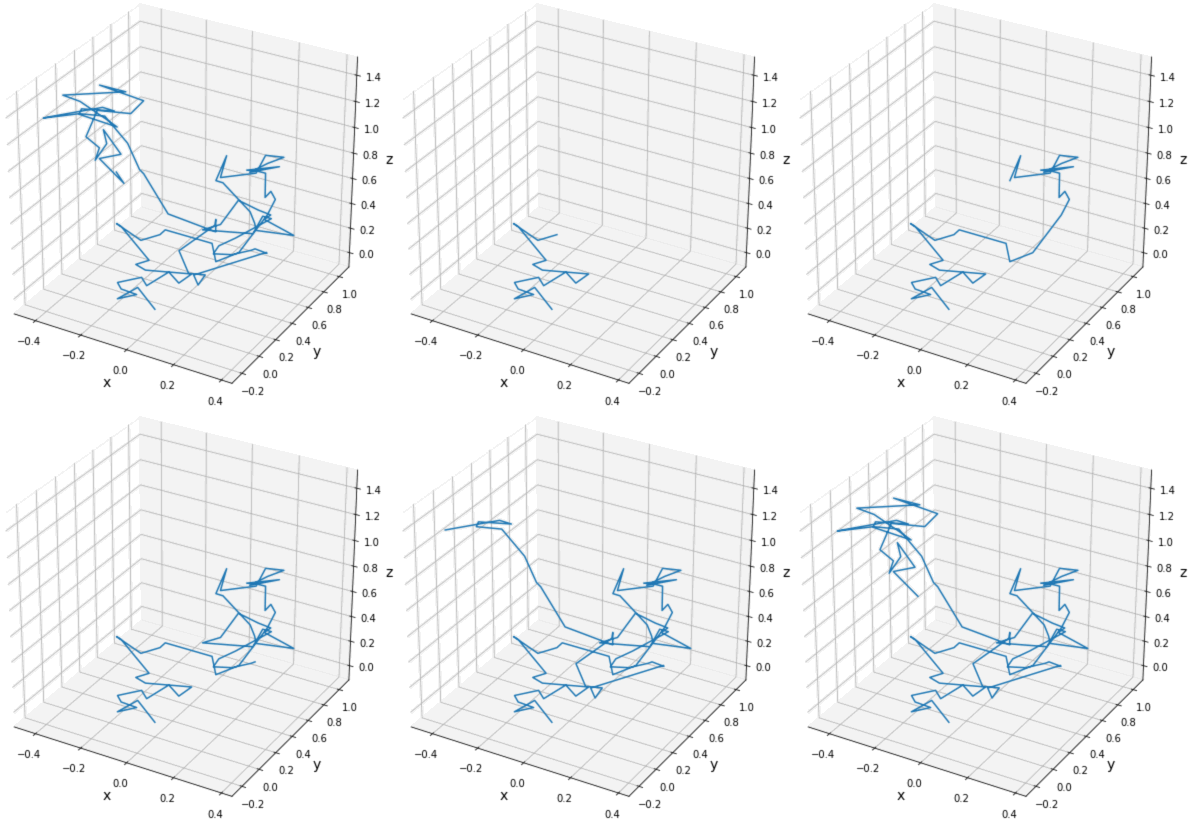
f:id:babaye:20191023205358g:plain

import numpy as np
import matplotlib.pyplot as plt
from matplotlib.animation import FuncAnimation
from IPython.display import HTML

n = 100

fig = plt.figure(figsize = (8, 8))
ax = fig.add_subplot(111, projection='3d')
ax.set_xlabel("x", size = 14)
ax.set_ylabel("y", size = 14)
ax.set_zlabel("z", size = 14)


x, y, z = [], [], []
g, = ax.plot([], [], [], '-', animated=True)
plt.close()

xmovement = np.cumsum(np.random.randn(n + 1)*0.1)
xmovement = np.append(np.array([0]), xmovement[:n])
ymovement = np.cumsum(np.random.randn(n + 1)*0.1)
ymovement = np.append(np.array([0]), ymovement[:n])
zmovement = np.cumsum(np.random.randn(n + 1)*0.1)
zmovement = np.append(np.array([0]), zmovement[:n])

ax.set_xlim(min(xmovement), max(xmovement))
ax.set_ylim(min(ymovement), max(ymovement))
ax.set_zlim(min(zmovement), max(zmovement))

def init_func():
    return g,

def func(frame):
    x.append(xmovement[int(frame)])
    y.append(ymovement[int(frame)])
    z.append(zmovement[int(frame)])
    g.set_data(x, y)
    g.set_3d_properties(z)
    return g,

a = FuncAnimation(fig, func, frames=np.linspace(0, n, n),
                    init_func=init_func, blit=True)

HTML(a.to_jshtml())

(準)凹関数の証明方法

とある関数が凹関数(準凹関数)かどうか証明したいときに参考にして欲しい
まずは結論から

結論

ヘッセ行列を作り、①左上と②右下(diagonal elements)が0以下であること、③行列式(determinant)が0であることを示せば良い

例題: u \left( x _ { 1 } , x _ { 2 } \right) = \ln \left( x _ { 1 } \right) + x _ { 2 }は準凹関数であるか?

式:ヘッセ行列は

 \displaystyle \mathbf{H} = \begin{bmatrix}
\frac { \partial ^ { 2 } u \left( x _ { 1 } , x _ { 2 } \right) } { \partial x _ { 1 } ^ { 2 } } & \frac { \partial ^ { 2 } u \left( x _ { 1 } , x _ { 2 } \right) } { \partial x _ { 1 } \partial x _ { 2 } } \\\ 
\frac { \partial ^ { 2 } u \left( x _ { 1 } , x _ { 2 } \right) } { \partial x _ { 1 } \partial x _ { 2 } } & \frac { \partial ^ { 2 } u \left( x _ { 1 } , x _ { 2 } \right) } { \partial x _ { 2 } ^ { 2 } } 
\end{bmatrix}

で求められる。

左上成分
 \frac { \partial ^ { 2 } u \left( x _ { 1 } , x _ { 2 } \right) } { \partial x _ { 1 } ^ { 2 } } = -\frac{1}{x^{2}} \leq 0 \cdots ①

右上、左下成分
 \frac { \partial ^ { 2 } u \left( x _ { 1 } , x _ { 2 } \right) } { \partial x _ { 1 } \partial x _ { 2 } } = 0

右下成分
 \frac { \partial ^ { 2 } u \left( x _ { 1 } , x _ { 2 } \right) } { \partial x _ { 2 } ^ { 2 } } = 0 \leq 0 \cdots ②

ここで、

 \mathbf{A} = \begin{bmatrix}
a & b \\\ 
c & d  \end{bmatrix}のとき、 \det{\mathbf{H}} = ad - bc

より、


\begin{aligned}
\det{\mathbf{H}} = &\frac { \partial ^ { 2 } u \left( x _ { 1 } , x _ { 2 } \right) } { \partial x _ { 1 } ^ { 2 } } \times \frac { \partial ^ { 2 } u \left( x _ { 1 } , x _ { 2 } \right) } { \partial x _ { 2 } ^ { 2 } } \\\
&-  \frac { \partial ^ { 2 } u \left( x _ { 1 } , x _ { 2 } \right) } { \partial x _ { 1 } \partial x _ { 2 } } \times \frac { \partial ^ { 2 } u \left( x _ { 1 } , x _ { 2 } \right) } { \partial x _ { 1 } \partial x _ { 2 } } \\\
= & 0 \cdots ③\\\
\end{aligned}

①、②、③より u \left( x _ { 1 } , x _ { 2 } \right)は凹関数である。 (※凹関数であることを証明したい場合は、「全ての凹関数は準凹関数なので、 u \left( x _ { 1 } , x _ { 2 } \right)は準凹関数である」の一文を最期に追加)

Rで2つの重回帰モデルをF検定で比較したときの結果の見方(実行例)

結論

2つの重回帰分析モデルのどちらがいいかは、F検定を用いて比較できる

anova(small_model, large_model)

を実行し、有意、つまりp値が低かったらlarge_modelを使うべき、高かったらsmall_modelを使うべき

コード例:

model1 <- lm(drivers ~ kms + PetrolPrice, data=Seatbelts)
model2 <- lm(drivers ~ kms + PetrolPrice + law, data=Seatbelts)
anova(model1, model2)

実行例

今回はRに元々ダウンロードされている「Seatbelts」というデータセットで例を確かめていく。Seatbeltsはイギリスの交通事故についての月別の時系列データである。

View(Seatbelts)

f:id:babaye:20200530145258p:plain
Seatbeltsデータ外観

ちなみに今回使うSeatbeltsの変数は4つ:

  1. drivers:運転による月間死者数
  2. kms:国民全体の当月の自動車走行距離
  3. PetrolPrice:当月の平均ガソリン価格
  4. law:シートベルト着用義務の法律が施行された1983年以降は1、それより前は0

まずは2つの回帰式を考えていく

 \displaystyle \text{drivers} = \beta_0 + \beta_1 \text{kms} + \beta_2 \text{PetrolPrice} + \varepsilon

 \displaystyle \text{drivers} = \beta_0 + \beta_1 \text{kms} + \beta_2 \text{PetrolPrice} + \beta_3 \text{law}+ \varepsilon

上をmodel 1, 下をmodel 2と呼ぶことにする。

Rでの実行↓

model1 <- lm(drivers ~ kms + PetrolPrice, data=Seatbelts)
model2 <- lm(drivers ~ kms + PetrolPrice + law, data=Seatbelts)

つまり、運転による死者数は走行距離数などと、どう関係しているのかをここでは見ている。

ここで、model 1とmodel 2の違いは、lawの有無である。

model 2の方が優れていると判断されれば、lawをmodel 1に加えるべきと結論づけても良さそうだ。

どちらのモデルが優れているときにはF検定を使う。

F検定とは、以下の仮説検定を行うことである。

 \displaystyle H_0: \beta_3 = 0 \iff model 1の方が優れている

 \displaystyle H_1: \beta_3 \neq 0\iff model 2の方が優れている

RでF検定を実行する際は、anova(small_model, large_model)とし、変数の少ない回帰式を最初に書く↓

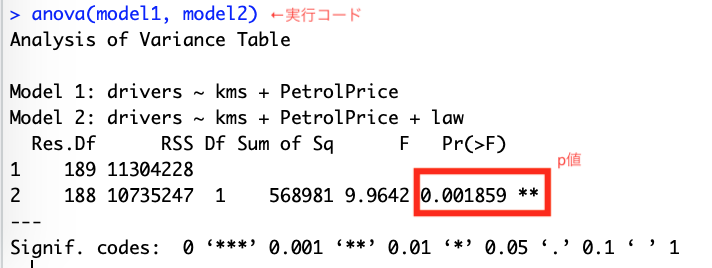
anova(model1, model2)

すると、以下のような結果が表示される

f:id:babaye:20190812011227p:plain

p値を確認すると、0.001859であった。これは5%より低いので、帰無仮説H_0は棄却される。つまり変数lawを含んだmodel 2の方を使うべきである。


補足:

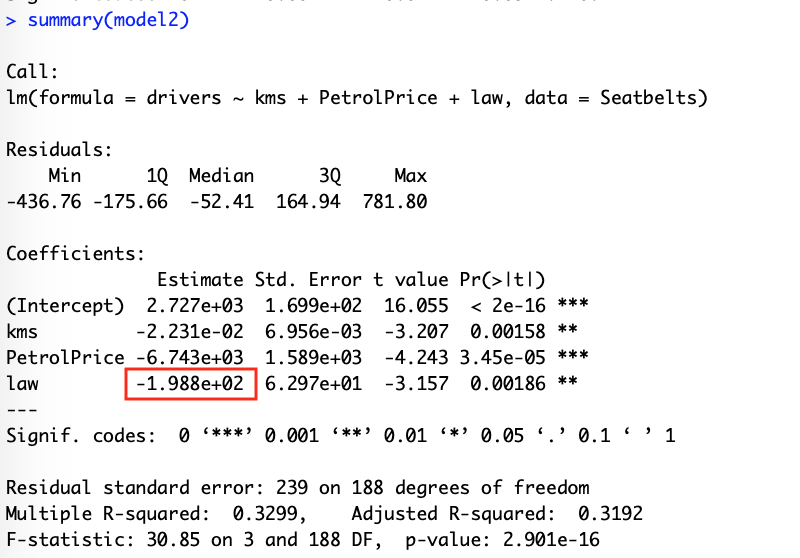
  1. 「結局法律変更で何かが変わることはわかったけど、法律は事故減少に役立ってるの?」への解答 f:id:babaye:20190812011248p:plain model 2の変数lawの係数は-1.988e+02で、負の値である。法律がある状態が law = 1なので、法律がある状態の方が事故が少ない。よって法律は事故減少に効果あり。

  2. 複数の変数をチェックする時、仮説検定は以下のようになる
    H_0: \beta_3 = \beta_4 = \beta_5 = 0
    H_1: \beta_3 \neq 0,  \beta_4 \neq 0, \beta_5 \neq 0 のどれか一つ以上が成り立つ

  3. 今回は多重共線性や誤差相関などは無視している。

Proof of Put-Call Parity with/without dividend

(Reference)

1. Without Dividend

(Before we begin...) What is Put-Call Parity?

 \displaystyle C-P=S-d \cdot K

Put-Call Parity is a relation between put price and call price shown above.

The meaning of alphabets are:

  • C : Call option's price (now)
  • P : Put option's price (now)
  • S : Stock price (now)
  • d : Discount factor. It takes value between 0~1, exclusive.
  • K : Strike price of call and put option (we assume that call option and put option have the same strike price)

Proof

Assume  S_{T} is a stock price at the end

  • Cost of buying one unit of stock =  S
  • Payoff buying one unit of stock = S_{T}

Then create a portfolio which includes:

  1. Buy one call
  2. Short sell one put
  3. Lend  d \cdot K to a bank

Then,

  • The cost of creating the portfolio =  C - P + d \cdot K
  • Payoff of the portfolio =

 \displaystyle  \max (0, S_{T} - K)

 \displaystyle - \max (0, K - S_{T}) + K

 \displaystyle = S_{T}

Here, the stock and the portfolio has the same payoff at the end.

Therefore, based on the no-arbitrage assumption, they should have the same cost.

Hence,  S = C - P + d \cdot K


2. With Dividend

The equation we want to prove is:

 \displaystyle C-P+D =S - d \cdot K

Where D is the dividend's present value.

Proof

Assume  S_{T} is a stock price at the end

  • Cost of buying one unit of stock =  S
  • Payoff buying one unit of stock = S_{T} + \frac{D}{d}

Then create a portfolio which includes:

  1. Buy one call
  2. Short sell one put
  3. Lend  D + d \cdot K to a bank

Then,

  • The cost of creating the portfolio =  C - P + D + d \cdot K
  • Payoff of the portfolio =

 \displaystyle \max (0, S_{T} - K)

 \displaystyle - \max (0, K - S_{T}) + K

 \displaystyle  + \frac{D}{d}

 \displaystyle = S_{T} + \frac{D}{d}

Here, the stock and the portfolio has the same payoff at the end.

Therefore, based on the no-arbitrage assumption, they should have the same cost.

Hence,  \displaystyle  S = C - P + D + d \cdot K

 \displaystyle  \iff C-P+D =S - d \cdot K